Date range comparison report in Data Studio
In data studio, you are not able to compare date range(s) out of the box. However, there is a way to do it, here I am going to show how to approach it.
The final report looks like that:
It was much easier than I thought to get to it! Steps are:
- Create a report in BigQuery that will have a comparison in itself. It needs 4 dates as variables (two ranges)
- Move the report to Data Studio, 2 dates are the default date range in Data Studio. 2 other dates are custom variables (parameters)
- A user provides 4 dates and the report works by itself 🙂
Data range comparison – assumptions
Let’s start with assumptions. The requirement is to have 3 columns:
- Country of a page visit
- Number of visitors (visitors_days) in period 1
- Number of visitors (visitors_days) in period 2
Of course, it is only to show the possibilities of comparison. I just created a report with 10 columns like product name, id, product category, revenue in period 1, revenue in period 2, and a couple of more.
Everything is created using Google Stack – BigQuery + SQL + Google Data Studio.
Calculating the number of visitor_days per country
To calculate such number you can run such code:
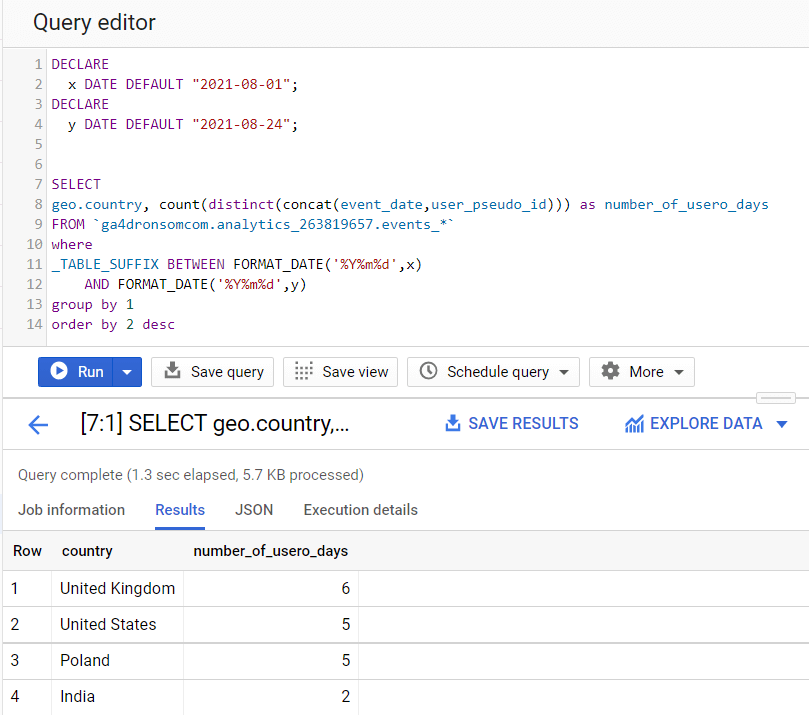
DECLARE
x DATE DEFAULT "2021-08-01";
DECLARE
y DATE DEFAULT "2021-08-24";


SELECT
geo.country, count(distinct(concat(event_date,user_pseudo_id))) as number_of_usero_days
FROM `ga4dronsomcom.analytics_263819657.events_*`
where
_TABLE_SUFFIX BETWEEN FORMAT_DATE('%Y%m%d',x)
AND FORMAT_DATE('%Y%m%d',y)
group by 1
order by 2 desc
The data for my page is:
Yeah, I know, not so many people 🙂
Next step is to have separate data for two date ranges:
#Declaring period 1 date range
DECLARE x DATE DEFAULT "2021-08-01";
DECLARE y DATE DEFAULT "2021-08-24";
#Declaring period 2 date range
DECLARE a DATE DEFAULT "2021-07-01";
DECLARE b DATE DEFAULT "2021-07-24";

with
Usero_days_by_country_date_range_1 as (
SELECT
geo.country, count(distinct(concat(event_date,user_pseudo_id))) as number_of_usero_days_period_1
FROM `ga4dronsomcom.analytics_263819657.events_*`
where
_TABLE_SUFFIX BETWEEN FORMAT_DATE('%Y%m%d',x)
AND FORMAT_DATE('%Y%m%d',y)
group by 1
order by 2 desc),
Usero_days_by_country_date_range_2 as (
SELECT
geo.country, count(distinct(concat(event_date,user_pseudo_id))) as number_of_usero_days_period_2
FROM `ga4dronsomcom.analytics_263819657.events_*`
where
_TABLE_SUFFIX BETWEEN FORMAT_DATE('%Y%m%d',a)
AND FORMAT_DATE('%Y%m%d',b)
group by 1
order by 2 desc
)
The last step regarding SQL is to link both date ranges by country. My approach to that is:
- Union both data
- Take only distinct countries (column 1)
- Left join information about first date range
- Left join information about second date range
So the code looks like this:
#Declaring period 1 date range
DECLARE x DATE DEFAULT "2021-08-01";
DECLARE y DATE DEFAULT "2021-08-24";
#Declaring period 2 date range
DECLARE a DATE DEFAULT "2021-07-01";
DECLARE b DATE DEFAULT "2021-07-24";

with
Usero_days_by_country_date_range_1 as (
SELECT
geo.country, count(distinct(concat(event_date,user_pseudo_id))) as number_of_usero_days_period_1
FROM `ga4dronsomcom.analytics_263819657.events_*`
where
_TABLE_SUFFIX BETWEEN FORMAT_DATE('%Y%m%d',x)
AND FORMAT_DATE('%Y%m%d',y)
group by 1
order by 2 desc),

Usero_days_by_country_date_range_2 as (
SELECT
geo.country, count(distinct(concat(event_date,user_pseudo_id))) as number_of_usero_days_period_2
FROM `ga4dronsomcom.analytics_263819657.events_*`
where
_TABLE_SUFFIX BETWEEN FORMAT_DATE('%Y%m%d',a)
AND FORMAT_DATE('%Y%m%d',b)
group by 1
order by 2 desc
),

DistinctCountries as (
select * from (
select country from Usero_days_by_country_date_range_1
union all
select country from Usero_days_by_country_date_range_2
)
group by 1
)

select country, if(number_of_usero_days_period_1 is null,0,number_of_usero_days_period_1) as number_of_usero_days_period_1, if(number_of_usero_days_period_2 is null,0,number_of_usero_days_period_2) as number_of_usero_days_period_2 from(
select * except (country_1, country_2) from (
select * from (
select * from DistinctCountries
left join
(select country as country_1, number_of_usero_days_period_1 from Usero_days_by_country_date_range_1)
on
country=country_1
)
left join
(select country as country_2, number_of_usero_days_period_2 from Usero_days_by_country_date_range_2)
on
country=country_2
))
order by number_of_usero_days_period_1 desc, number_of_usero_days_period_2 desc
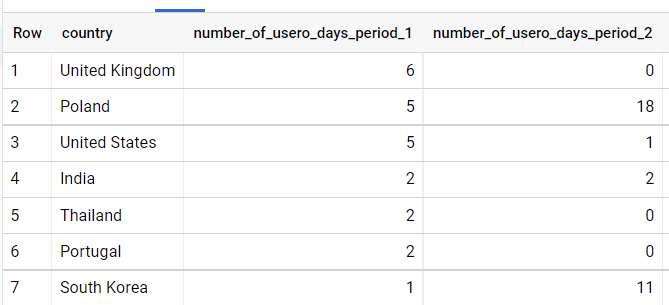
Results after running such code:
Moving data range query into Data Studio
The hardest part is done :). Now we need to move those queries (with two separate time ranges) into a data studio and allow a user to choose date ranges separately.
Create a blank report in Data Studio it will automatically ask you to connect the data. Choose BigQuery -> Custom Query -> Your Project. Now tick “Enable date range parameters”.
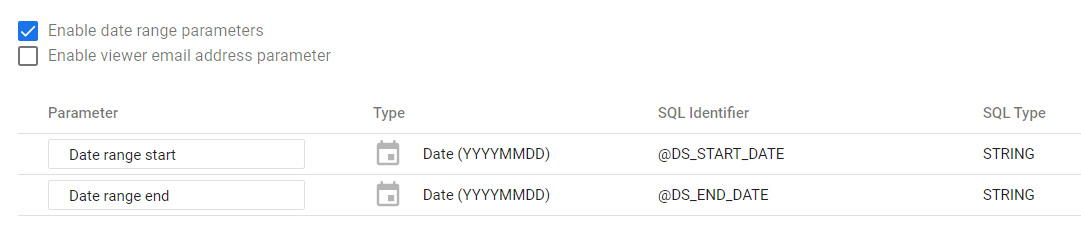
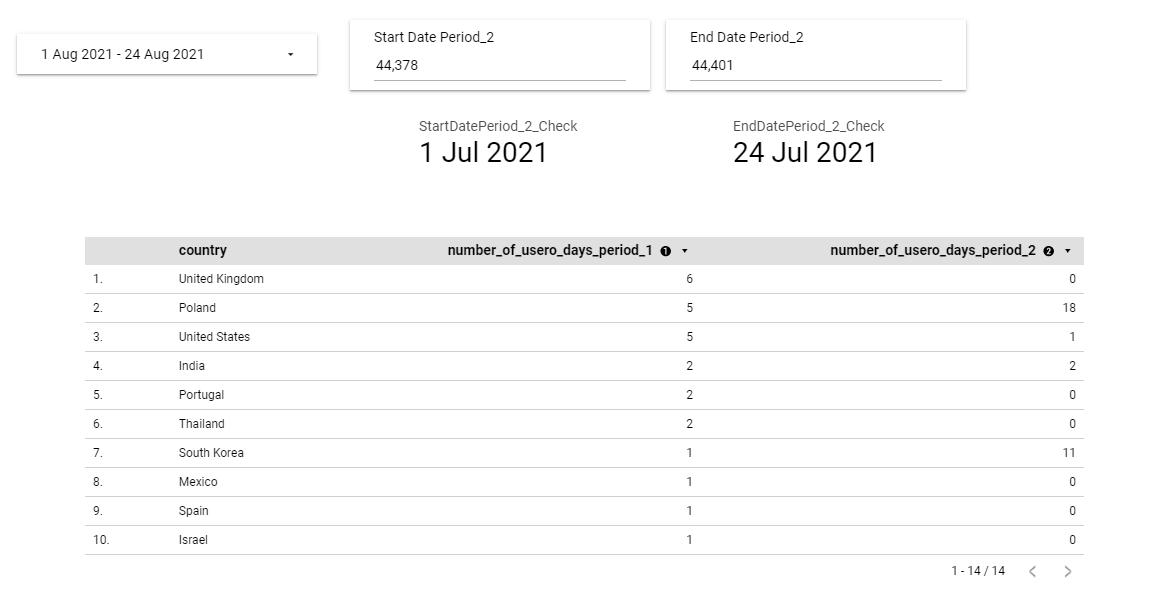
It gives the first period which the user will set as default time range control in Data Studio.
Now the non-standard approach. Add a parameter. You can do it as here:
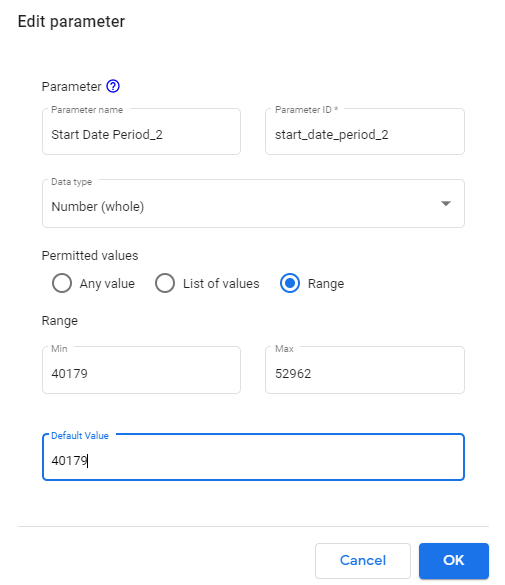
Next, create a new parameter “End Date Period_2”, everything should be like in “Start Date Period_2”. Those two non-standard parameters will let the user choose a second date range. It will not be a default way to provide dates. The user will need to provide numbers as days. I will describe it later, in the nutshell 1 is the date of 01.01.1900 and each day is +1. So currently (April 2021) we are about 44 000.
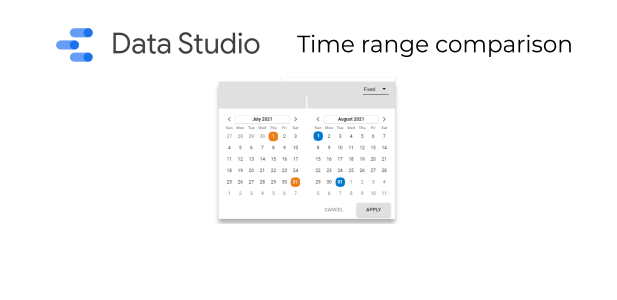
Setting two separate date ranges for comparison in DataStudio
The only trouble now is to change the dates. The first date range is plain simple – just changing them to @DS_START_DATE and @DS_END_DATE. There is a little bit more hassle with the second date range. Still doable 😉
replace ( cast ( DATE_ADD(PARSE_DATE('%Y%m%d', "19000101"), INTERVAL @start_date_period_2-2 day) as string),"-","")
So the whole code which is needed in Data Studio BigQuery connector is:
with
Usero_days_by_country_date_range_1 as (
SELECT
geo.country, count(distinct(concat(event_date,user_pseudo_id))) as number_of_usero_days_period_1
FROM `ga4dronsomcom.analytics_263819657.events_*`
where
_TABLE_SUFFIX BETWEEN
#FORMAT_DATE('%Y%m%d',x)
# AND
#FORMAT_DATE('%Y%m%d',y)
@DS_START_DATE
and
@DS_END_DATE
group by 1
order by 2 desc),


Usero_days_by_country_date_range_2 as (

SELECT
geo.country, count(distinct(concat(event_date,user_pseudo_id))) as number_of_usero_days_period_2
FROM `ga4dronsomcom.analytics_263819657.events_*`
where
_TABLE_SUFFIX BETWEEN
# FORMAT_DATE('%Y%m%d',a)
# AND
# FORMAT_DATE('%Y%m%d',b)
replace (
cast (
DATE_ADD(PARSE_DATE('%Y%m%d', "19000101"), INTERVAL @start_date_period_2-2 day) as string),"-","")
and
replace(
cast (
DATE_ADD(PARSE_DATE('%Y%m%d', "19000101"), INTERVAL @end_date_period_2-2 day) as string),"-","")
group by 1
order by 2 desc
),
DistinctCountries as (
select * from (
select country from Usero_days_by_country_date_range_1
union all
select country from Usero_days_by_country_date_range_2
)
group by 1
)
select country, if(number_of_usero_days_period_1 is null,0,number_of_usero_days_period_1) as number_of_usero_days_period_1, if(number_of_usero_days_period_2 is null,0,number_of_usero_days_period_2) as number_of_usero_days_period_2 from(
select * except (country_1, country_2) from (
select * from (
select * from DistinctCountries
left join
(select country as country_1, number_of_usero_days_period_1 from Usero_days_by_country_date_range_1)
on
country=country_1
)
left join
(select country as country_2, number_of_usero_days_period_2 from Usero_days_by_country_date_range_2)
on
country=country_2
))
order by number_of_usero_days_period_1 desc, number_of_usero_days_period_2 desc
The last thing to do is to create a user date range and input.
First date range:
Insert -> Date range control -> put it at the beginning of your report. This is how a user will choose dates for time period 1.
Second date range:
Add a box, where the user can put a number. Insert -> Input box -> change control field to “Start Date Period_2” and add it once more, this time set control field to “End Date Period_2”.
Done!
Now you can choose 4 dates, which creates two-time ranges to compare.
The first two are from native Google Data studio date range control. And second two providing two numbers that represent dates. You can ask how to get the number from the date? It is a good question. Fortunately, it is pretty simple. Just put a date into google sheets or excel, copy that and paste as values and change the formatting to a standard number.
Comparing Time Periods Across Date Ranges in Business Intelligence
I spent a couple of weeks thinking about what to do with the report, where I needed a time range comparison. I was considering moving to Looker, making a report in Excel VBA, or Google Scripts. Fortunately, I found this solution! Article regarding parameters in DataStudio on OptimizeSmart helped me a lot.
I’m really surprised it was so easy to overcome one of the biggest issue of Google Data Studio which is no way to compare data ranges. Now I know it is possible!
If you would like to check it on video, here it is:
Nice breakthrough! Thank you very much!
But I have a question altought. What happens if I have multiple dimensions? Because in your example you use just 1 dimension.
Thank you again!
I mean, if there are more dimensions, there would be more steps or the same amount of steps of this guide?
Thank you,
Hi!
You sure can have multiple dimensions. So let’s say you would like to have 2 columns about products in time range one. For example:
– product id
– number of users who where on product page (time range 1)
– number of times product was acquired (time range 1)
So to do that you just need something like:
select product_id, count(distinct(user_pseudo_id_who_was_on_product_page)), count(number_of_transactions_with_product) from TableTime1
group by 1
And now you would like to have additional two columns:
– number of users who where on product page (time range 2)
– number of times product was acquired (time range 2)
To have this table you need something like:
select product_id, count(distinct(user_pseudo_id_who_was_on_product_page)), count(number_of_transactions_with_product) from TableTime2
group by 1
And now the only thig is to combine those two tables in SQL. For example:
select * from (
select * AllProductIDs
left join
MyFirstTable
on productId=ProductId_table1
)
left join
MySecondTable
on productId=ProductId_table2
It may not be pretty. But it works. It does not matter how many dimensions you would like to have 🙂
Let me know if you understand how to do it now
Thank you for the reply Dronsom!
I guess I’m not understanding it :/ . (Sorry for not getting it)
In your example with the product_id column seems to me the same as the original example with the country column. Because there is just 1 non numeric column (in this case ‘product_id and in hte original one ‘geo_country’)
But how would it be if it’s like this, for example?:
You have this:
– product_id
– geo_country
– number of users who where on product page (time range 1)
– number of times product was acquired (time range 1)
– Number of visitors (visitors_days) (time range 1)
And you want to add this:
– number of users who where on product page (time range 2)
– number of times product was acquired (time range 2)
– Number of visitors (visitors_days) (time range 2)
Thank you again for this major breakthrough!
Hi!
Ok, so what you want is 8 columns:
– product_id
– geo_country
– number of users who where on product page (time range 1)
– number of times product was acquired (time range 1)
– Number of visitors (visitors_days) (time range 1)
– number of users who where on product page (time range 2)
– number of times product was acquired (time range 2)
– Number of visitors (visitors_days) (time range 2)
Right?
So lets’ create two queries:
#Query1 which will have:
– product_id
– geo_country
– number of users who where on product page (time range 1)
– number of times product was acquired (time range 1)
– Number of visitors (visitors_days) (time range 1)
#Query2 which will have:
– product_id
– geo_country
– number of users who where on product page (time range 2)
– number of times product was acquired (time range 2)
– Number of visitors (visitors_days) (time range 2)
And then let’s create (Query3) a table which have all “dimensions” from both columns so something like:
select * from (select product_id, geo_country from Query1
union all
select product_id, geo_country from Query2
)
group by 1,2
No the only thing which you will need is to link Query3 with Query1 and Query2. So step by step (Query4):
select * from Query1left join
(select product_id as product_id_1, geo_country as geo_country_1 from Query1)
on
product_id = product_id_1 and geo_country = geo_country_1
This way you already have table with:
– product_id
– geo_country
– product_id_1
– geo_country_1
– number of users who where on product page (time range 1)
– number of times product was acquired (time range 1)
– Number of visitors (visitors_days) (time range 1)
Now you only need to add additional columns (Query5):
select * from Query4left join
(select product_id as product_id_2, geo_country as geo_country_2 from Query1)
on
product_id = product_id_2 and geo_country = geo_country_2
And with this you will have columns:
– product_id
– geo_country
– product_id_1
– geo_country_1
– number of users who where on product page (time range 1)
– number of times product was acquired (time range 1)
– Number of visitors (visitors_days) (time range 1)
– product_id_2
– geo_country_2
– number of users who where on product page (time range 2)
– number of times product was acquired (time range 2)
– Number of visitors (visitors_days) (time range 2)
The only thing left is to get rid of columns which you do not need:
select * except(product_id_1, product_id_2, geo_country_1, geo_country_2) from Query5Whole idea is to join based on all (with and!) “dimensions” which you have. It does not matter if you have 2 or 15 of them. It just makes query a little bit more complicated, but idea is the same
Of course with that you can create a graph i data studio (rebranded to looker) comparing it all (maybe with two dimensions it is harder than with one, but probably doable)
Let me know if it’s clear now!