Raw Data from GA4 in Google Cloud / BigQuery – First Steps
Raw Data gives the most flexibility allowing us to make “any” report which is possible from gathered data. E-commerce businesses needs tailored reporting, meaning it is a great advantage of e-commerce to user Raw Data reporting.
What is Raw Data?
It is unprocessed (pure, without any change, in a natural state) data. Meaning you have access to the very bottom of the data gathered from user interaction with your website. Imagine a very big Excel table where each row is a HIT. Ok, what is a hit?
Hit is data that is sent when a user interacts with a page. Let’s assume a user comes to the main website of some e-commerce site, goes to a product page, adds a product to the cart, and leaves the site. In such a case* it makes 3 hits:
- page_view of the main site
- page_view of the product page
- add_to_cart
In RawData you would get 3 raws. Each row would have information such as:
- event_name (page_view or add_to_cart in our case)
- a timestamp of action (exact date, time, second, millisecond of the interaction)
- user’s cookie id (so you can measure user activity across days, weeks, months, etc. and check how many “users” were on your site)
- URL of the site on which a user was
- The ID of product which was added to cart
Raw Data table example
The data in a described case can look like this:
| Event_name | CookieID | url | Timestamp | ProductID |
| page_view | 193.1614 | https://mydomain.com | 1614618533711290 | null |
| page_view | 193.1614 | https://mydomain.com/product_1 | 1614618533951975 | null |
| add_to_cart | 193.1614 | https://mydomain.com/product_1 | 1614618535352537 | 1 |
The main point regarding RawData is that you get all the information which are gathered from user interaction with your website. Of course in real life, such a table will have much more columns. User browser, device, device category, page title, product value, product name, and many more columns.
Same with raws. Imagine 100 users going to a site and making described interactions. It will create 300 raws. Not to mention that big businesses (where raw data is “a must”) have hundreds of thousands of users each month. Each making some interaction with the site.
A number of rows go easily into millions! However, it does not change anything. If you get the idea, the amount of columns or rows is just the expansion that computer will process 😉
To sum up, Raw Data (regarding page analytical tool) is data on hit and cookie level.
How is data gather from user interaction on website?
In most common way it is done via implemenation of javascript code on site. The code “fires” when user iteracts with the page. Code “firing” sends data to analtyical system (like Google Analytics 4). The great advantage of GA4 is that it gives you free** access to RawData! Google Analytics gives the same functionality in it’s payed version, cost ~5000 USD/month!
What is the use of page analytics Raw Data (like GA4)?
The main advantage of raw data is that you can create any report possible. You are no longer limited by the interface of the tool. Example uses are:
- checking user’s path toward purchase – it can be on session-level or month/year level (or both)
- raw data is used for attribution modeling. Probably it is possible without it but it is not a common practice
- joining data from a different system based on some user link (for example user logging to a site)
- improving cross-device with different user identifiers
- creating your own tailored maid reporting specific to your business
- all the above on unsampled data
- linking user page/app activity (measured with GA4) with his offline activity
Of course, you are able to segment your data by time/device/source of traffic etc.
Google Analytics 4 implementation with Raw Data access
Ok, now that you understand the “Why” (having access to RawData gives all data allowing to make flexible reporting) let’s go through setting everything up:
- Setting Google Cloud – where raw data is stored
- GA4 – where you need to set things up
- Google Tag Manager – it is the most common way to implement tracking on your site
- BigQuery – where you “play” with raw data
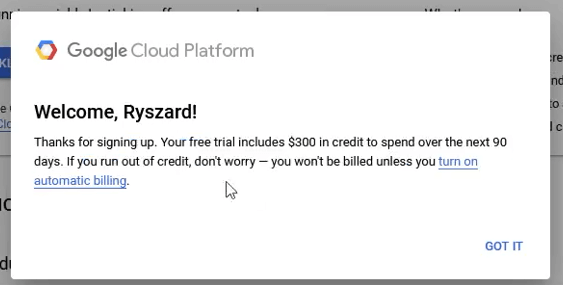
Turning on billing in Google Cloud
When logging in (on a fresh account) Google will grant you 300$ coupon to spent in Google Cloud. Of course, take that free bonus, but also turn on automatic billing. This way after linking GA4 with Google Cloud your data tables will not expire, and you will not be limited by the Sandbox version of GA4. To make it work after logging in on-screen confirming your sign in go to “turn on automatic billing”
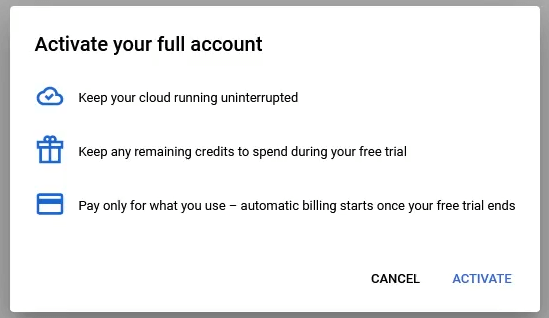
and then on the next screen click activate:
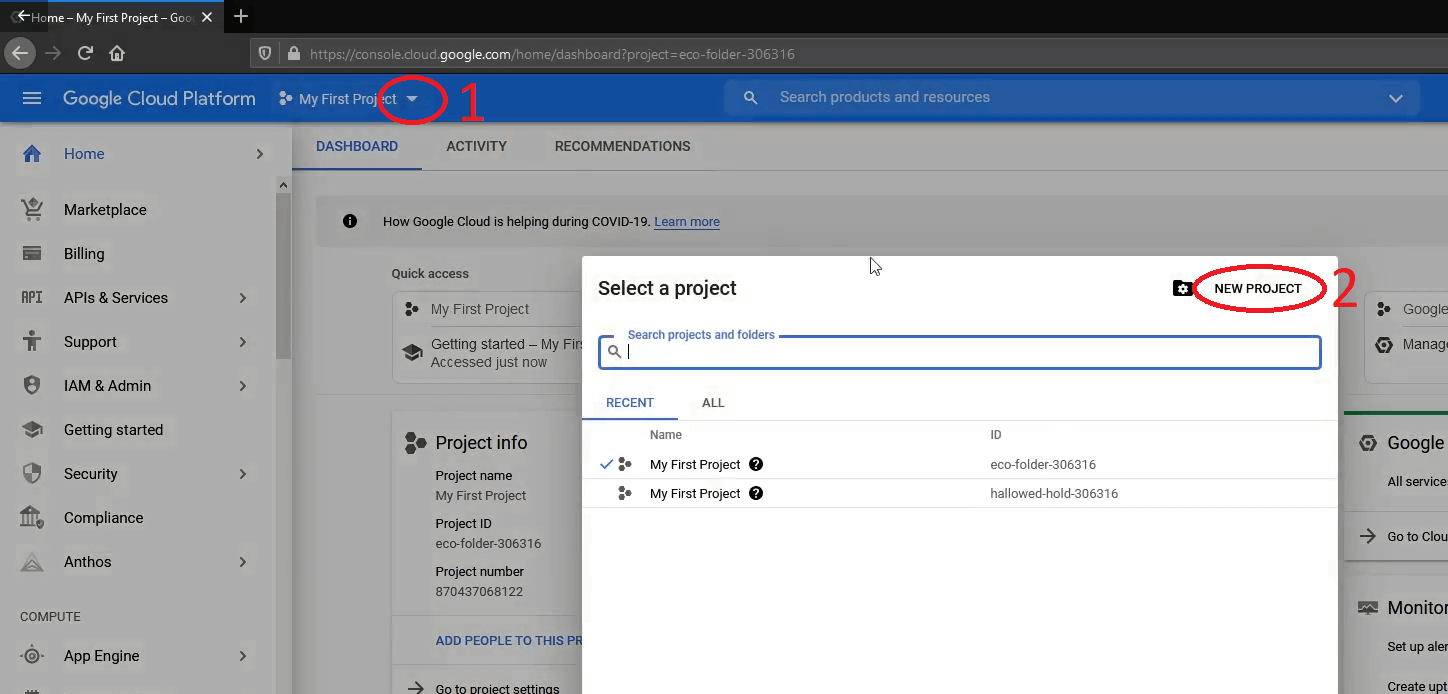
Creating a new project in Google Cloud
After getting to Google Cloud it is a good practice to have a separate project for GA4. Create such a project. Double-check if your project has billing enabled.
Turning on Google Analytics 4
In Google Analytics go to admin section and choose GA4 Setup Assistant. Then create a GA4 account.
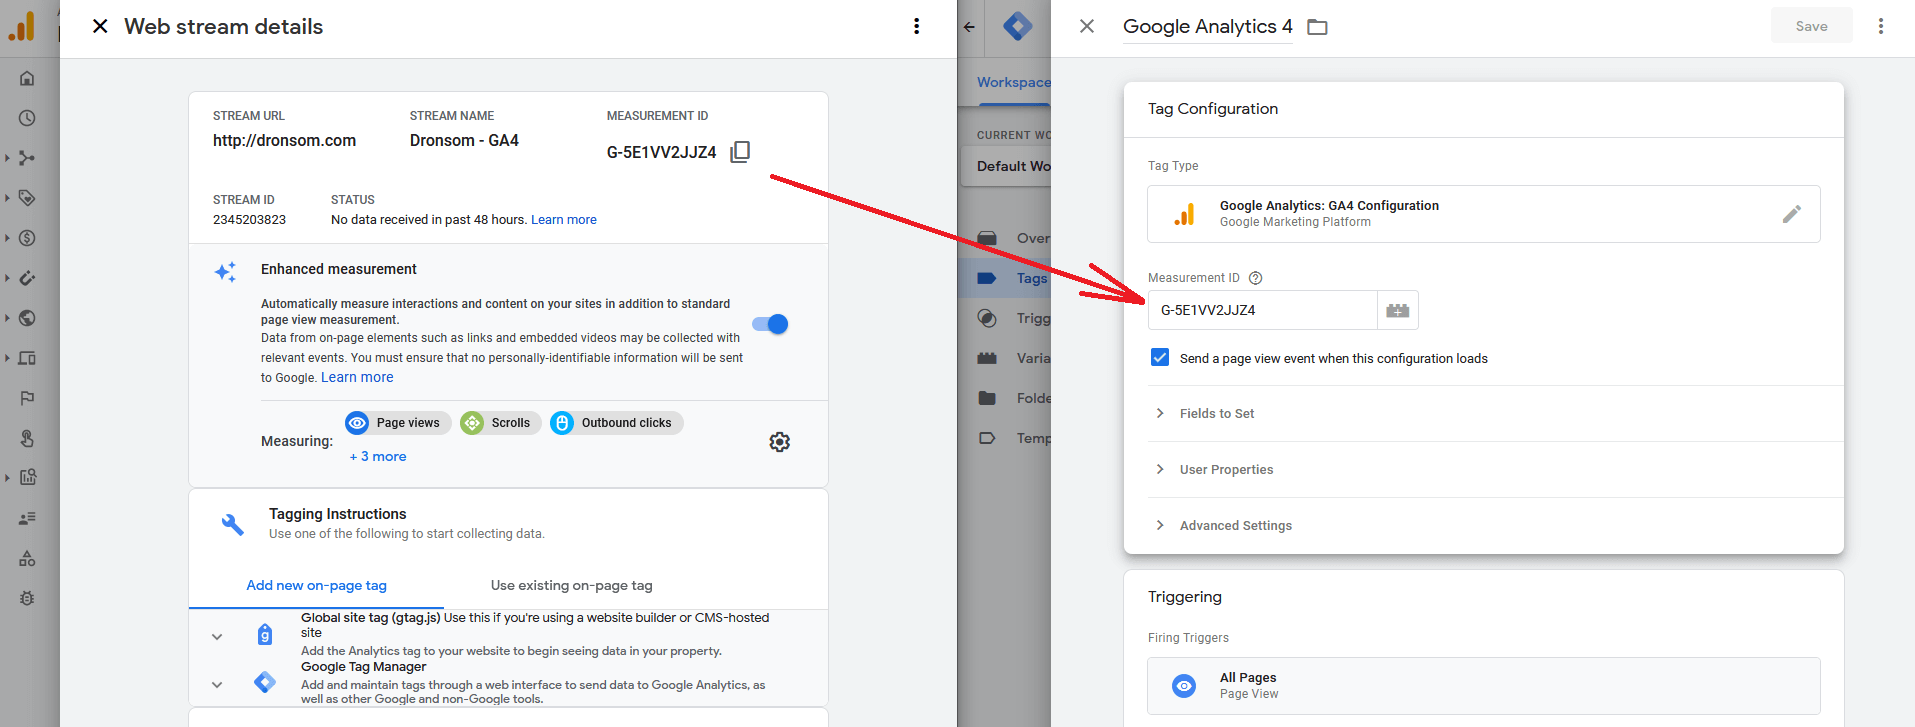
Implementation of GA4 tags onto your site
The next step is to implement GA4 tags on your site. I have just implemented GA4 tracking on https://dronsom.com with Google Tag Manager it requires “a couple of clicks”. In GTM at least your pageview tag and create a GA4 setting tag with firing the tag on pageview.
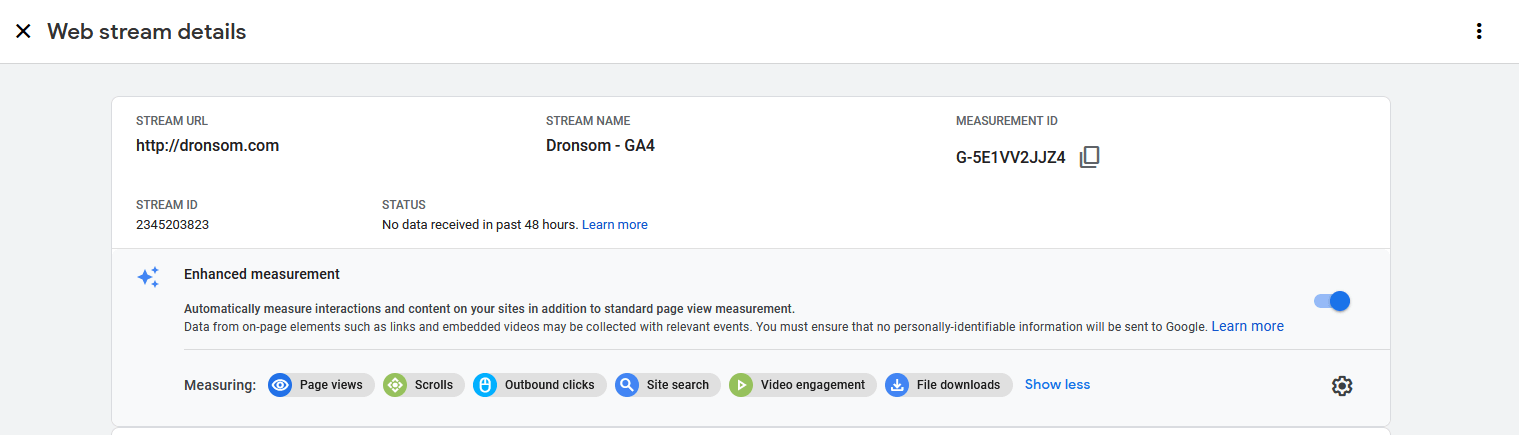
Enhanced Measurement in GA4
Pay attention to enhanced measurement. It should be turned on for most websites.
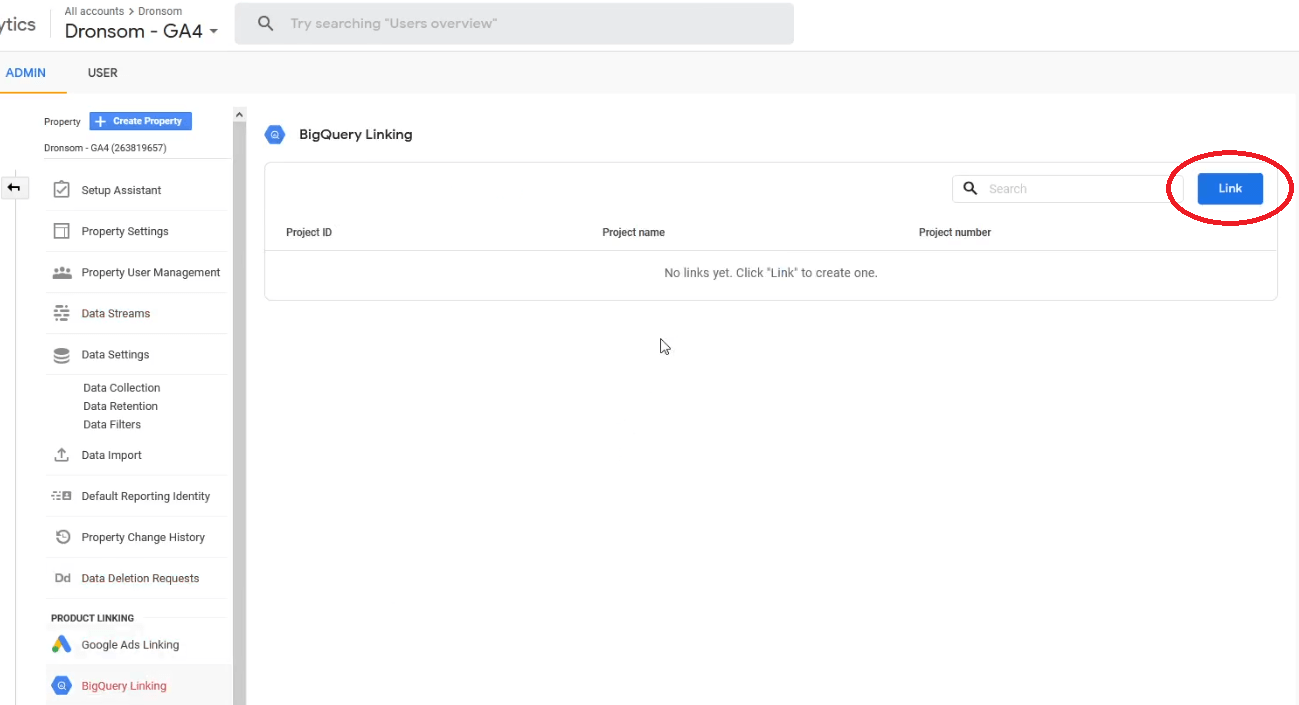
Setting up link GA4 <-> Google Cloud (BigQuery)
Finally in GA4 settings link it to Google Cloud choosing your newly created project.
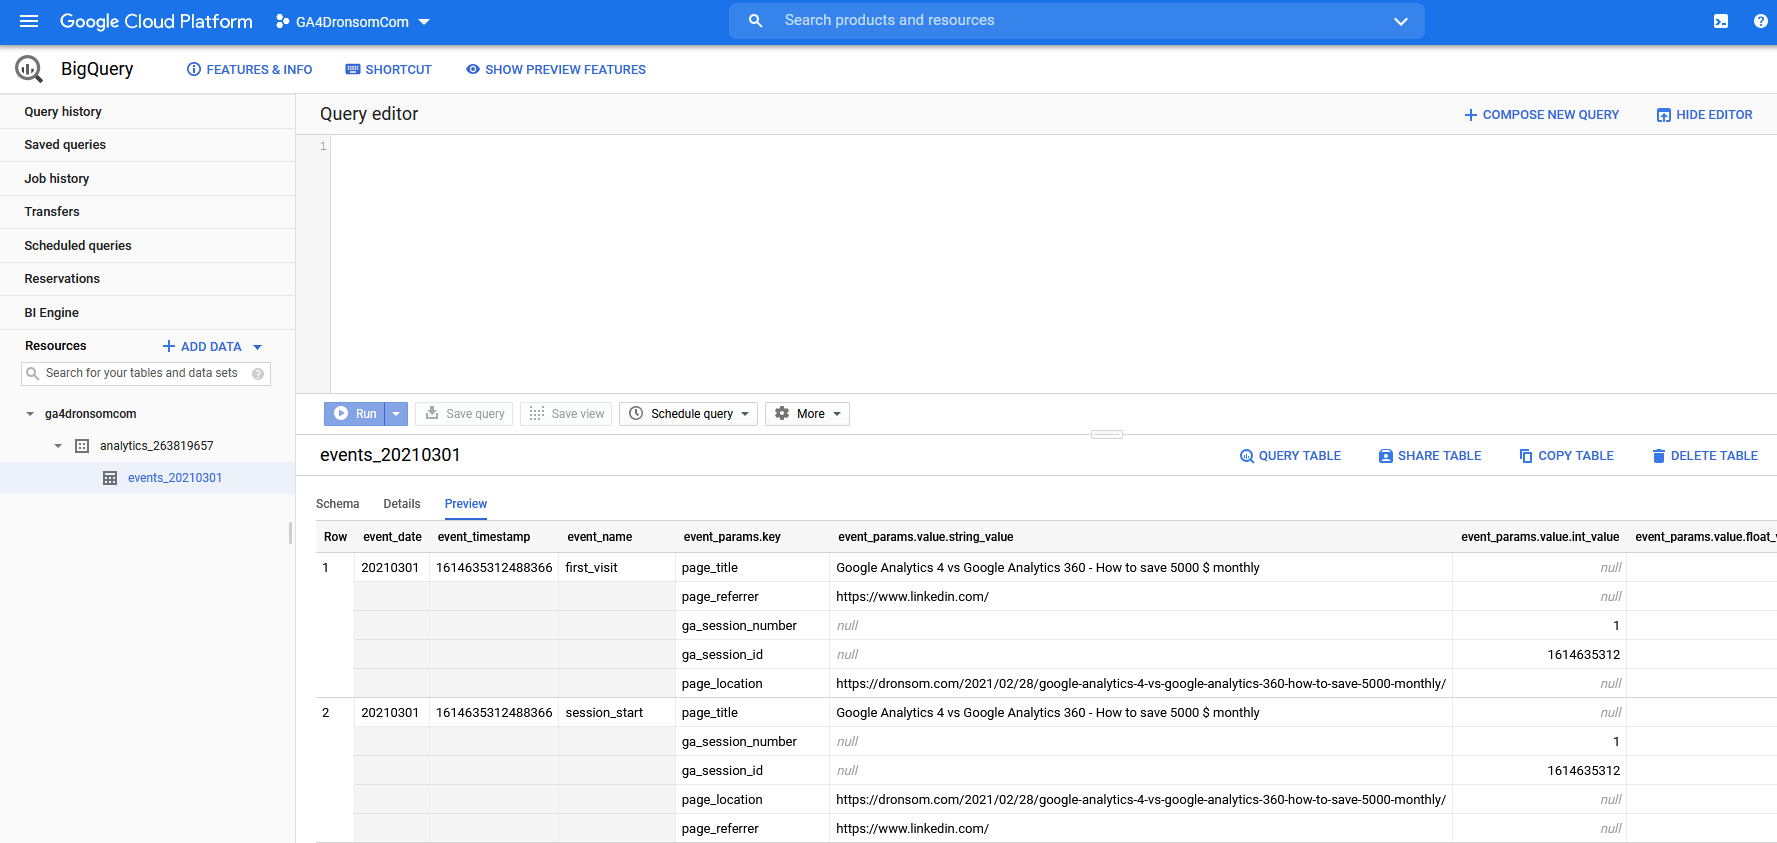
Raw Data Access
Your data is stored in Google Cloud, you access it with Google Big Query. Here it is required to know SQL to make queries.
And that’s all for the beginning. Yesterday (1st of March 2021) I started using Google Analytics 4 for dronsom.com Whole implementation process took me ~30 minutes. With a big e-commerce site, it would require much more work.
I have created a video regarding all the aspects described above. If you prefer this way feel free:
*It depends on the implementation. There is a way to measure also scrolls, and many other factors. But here I want to make it easy to understand.
**You are going to pay for data stored and process. However, if you are a small/medium page you will get it for free, as there are limits after which you start to pay.
Leave a Reply